GraVE Documentation
import networkx as nx
from networkx.algorithms.centrality import closeness_centrality
import matplotlib.pyplot as plt
from grave import plot_network, use_attributes
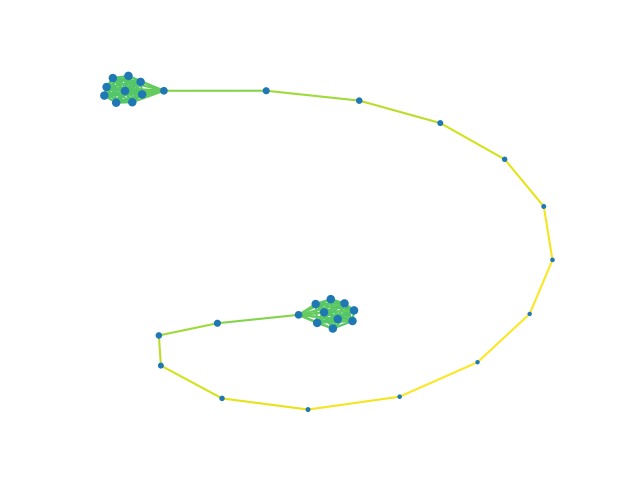
toy_network = nx.barbell_graph(10, 14)
toy_centrality = closeness_centrality(toy_network)
max_centrality = max(toy_centrality.values())
for u, v, edge_attributes in toy_network.edges.data():
c = (toy_centrality[u] +
toy_centrality[v]) / 2
color_idx = (c / max_centrality)
cmap = plt.get_cmap()
edge_attributes['color'] = cmap(color_idx)
edge_attributes['width'] = 2
for node, node_attributes in toy_network.nodes.data():
node_attributes['size'] = (1 - (toy_centrality[node] /
max_centrality) + .1) * 100
def edge_style(edge_attributes):
return {'linewidth': edge_attributes.get('weight', 1)}
fig, ax = plt.subplots()
plot_network(toy_network,
layout='spring',
node_style=use_attributes(),
edge_style=use_attributes('color'))
plt.show()
Total running time of the script: ( 0 minutes 0.154 seconds)